Anomaly detection with WSO2 Machine Learner

Anomaly detection with WSO2 Machine Learner

WSO2 Machine Learner (ML) provides a user friendly wizard like interface, which guides users through a set of steps to find and configure machine learning algorithms. The outcome of this process is a model that can be deployed in multiple WSO2 products, such as WSO2 Enterprise Service Bus (ESB), WSO2 Complex Event Processor (CEP), WSO2 Data Analytics Server (DAS) etc.

WSO2 ML 1.1.0 (new release) have the anomaly detection feature as well. It is implemented based on the K means clustering algorithm which is discussed on my previous article. In this article I will discuss the steps of building an anomaly detection model using WSO2 Machine Learner.

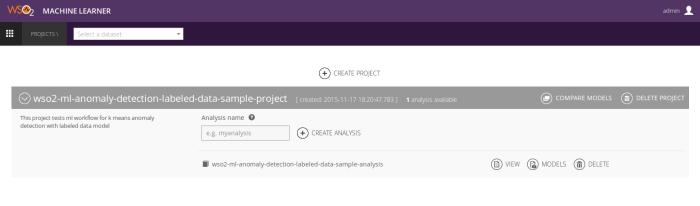
Step 1 – Create an analysis

For every model you have to first upload a dataset and create a new project. Then start a new analysis to build an anomaly detection model.

fig3

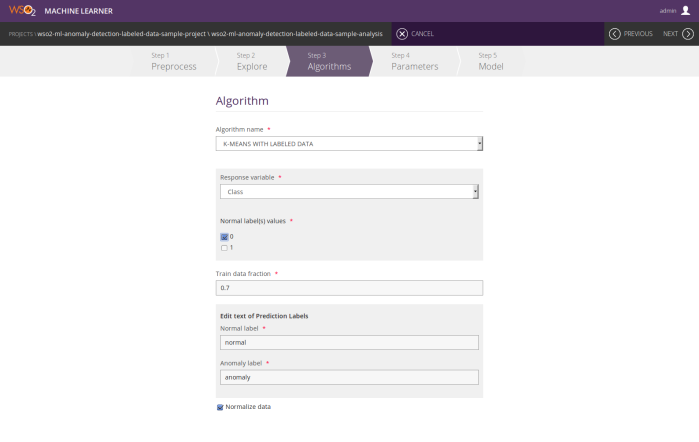
Step 2 – Algorithm selection

In the ‘Algorithm’ selection process there is a new category called ‘Anomaly Detection’. Under that category there are two algorithms. If your dataset is a labeled one you can select k-means with labeled data. Otherwise you can select k-means with unlabeled data. There are a few model configurations that you have to input in this step.

k-means anomaly detection with labeled data

  • Response variable
  • Normal label(s) values
  • Train data fraction
  • Prediction labels
  • Normalization option

fig4

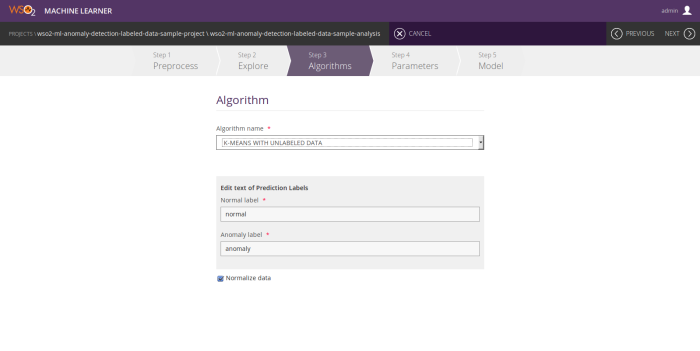
k-means anomaly detection with unlabeled data

  • Prediction labels
  • Normalization option

fig5

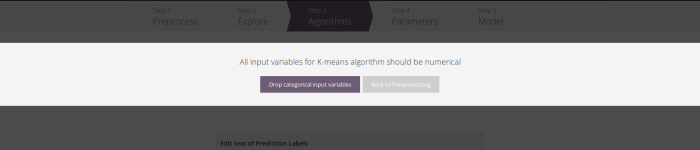
If any categorical features other than the response variable exists in the dataset you will be asked to drop them when you proceed to the next step.

fig6

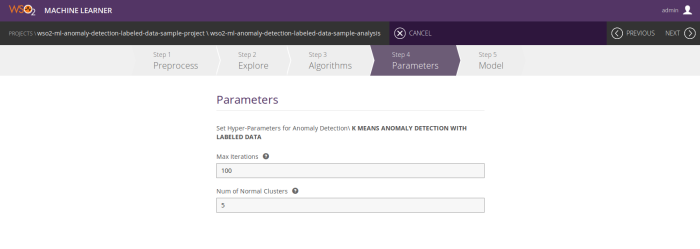
Step 3 – Hyper parameters

In the parameter selection step you have to input necessary hyper parameters for the model:

  • Maximum iterations
  • Number of normal clusters (since this anomaly detection algorithm is  implemented based on k-means clustering you have to input the number of normal clusters that should be built in the model)

fig7

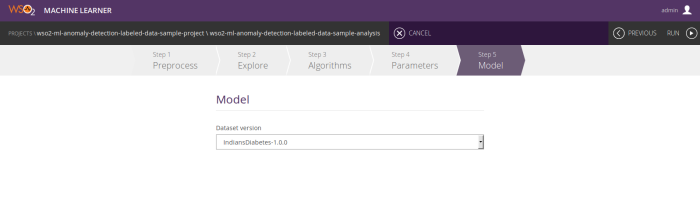
Step 4 – Model building

Then after selecting the dataset version you can build the model.

fig8

Step 5 – Model summary

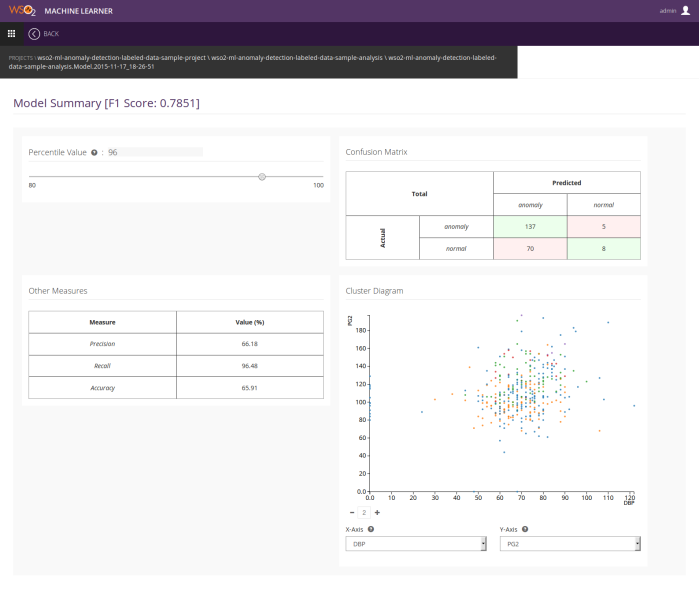
After successfully building the model you can view the model summary if you have built the model using k means with labeled data algorithm. The summary gives you an overall idea about the model. It will have useful information about the model such as its F1 score and some other important accuracy measures, confusion matrixes, cluster diagram, etc. So based on this information you will be able pick the best model.

The model is evaluated for the range of percentile values, i.e. for the range of cluster boundaries, to pick the best one. In the model summary, by default, you will see the measures with respect to best percentile value. You can see how the measures change according to the percentile by moving the percentile slider. Based on that you can form an idea about the best percentile value to use for your predictions.

By default we use the percentile range 80-100, but if you need a different range to evaluate the model you can change the range by entering minPercentile and maxPercentile as system properties when you start the server. Keep in mind that you need to input values between 0-100 as percentiles. You can input system properties when you start the server as shown below:

./wso2server.sh -DminPercentile=60 -DmaxPercentile=90
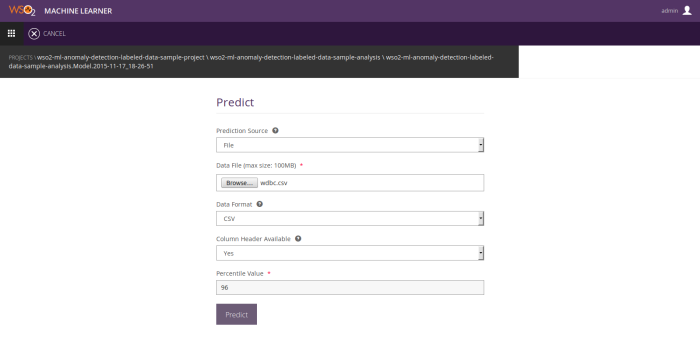
fig9

Step 6 – Prediction

This is where you can predict new data using the model. You need to input feature values of a new data point or you can give new data as a batch using a csv or tsv file. You should also input the percentile value to identify the cluster boundaries. The default value will already be there. You can keep it if you aren’t sure about it. If you had labeled data when building the model it will set the optimum value obtained from the model evaluation as the default value. After entering those values you will get the predictions for new data.

fig10

If you want to know more about WSO2 Machine Learner you can follow the documentation. You can download the product and try this out with your dataset and it is absolutely free!!!

Also you if you have more interesting ideas you can contribute to the product as well. You can find the source code of WSO2 ML from following repositories. wso2/carbon-ml, wso2/product-ml.


Anomaly Detection Using K means Clustering

Anomaly Detection Using K means Clustering

What are anomalies?

Anomalies are items, events or observations that do not conform to an expected pattern or other items in a data set. Anomalies can be found from any kind of domain. In network data different attacks can be categorized as anomalies. In a production line of a factory fault products can be categorized as anomalies. In commercial transactions frauds can be categorized as anomalies. Those are few examples of anomalies.

Why anomaly detection is critical?

In most of the real world scenarios of anomaly detection are very critical. They are rare events that may have great significance but are difficult to identify. So It is very important that identifying the anomalies and take necessary steps to stop or reduce the bad outcome. As examples anomaly detection can be used to identify possible illnesses such as cancers, heart attacks before it grows significantly. Also you can block fraudulent transactions before it goes through. You can detect unexpected network attacks as well as you can identify unexpected weather changes before it occurs significant damage by using real time anomaly detection techniques.

fraud

Why general machine learning techniques doesn’t suits for anomaly detection?

most of the machine learning algorithms works in a way that they train the model using the available data. So to achieve better accuracy rates those algorithms need quite large amount of data to do the training and build the models. But in the anomaly detection scenario anomalous data are very rare. As an example fraudulent transactions to normal transaction ratio could be 1:10,000. So always there is an unbalanced situation between normal and anomalous data. Because of that we can’t apply most of the common machine learning algorithms to anomaly detection scenario. Even though we apply, accuracy rates will be very less.

Why clustering is good at Anomaly Detection?

Clustering is an unsupervised machine learning algorithms. In simply what we do in clustering is we group the data by considering the similarities of data. So once we do the clustering we will get some clusters with heterogeneous data inside each clusters. Data distribution of the clusters are very important for anomaly detection scenario. Due of the rareness of anomalous data those will be distributed more like outliers to the clusters rather than making a different cluster. We are more considering here is detecting unknown anomalies which can’t be identified using few simple rules or applying a knowledge of a domain expert. Those anomalies can be rise as an unexpected way and also those anomalies won’t have similar behaviors in every time. Another advantage is we can apply clustering despite the fact that data set is very high dimensional.

How Anomaly Detection Algorithm works?

First step is clustering the data set. For that we use K means algorithm. It will basically do the clustering based on the distance between data points. After we run the algorithm we get K number of clusters. Since the K means works with only numerical data if there are any categorical features we will have to drop them before apply the K means algorithm.

Then the next step is to identify the cluster boundaries. For that we consider a percentile distance value rather than considering the maximum distance point of each cluster with their cluster centers. The reason is that anomalous data. We assume that anomalous data also can be included in the clusters. But because of the deviation from normal behavior those anomalies will be mostly in far distance away with their cluster centers than normal data. So those anomalies still can be near the cluster boundaries. If we consider the max distance as cluster boundary those anomalies also will be taken into the clusters. So to avoid that we consider a percentile distance value (ex: 95th percentile from all distances between data points and their respective cluster centers of each cluster)

So after determining the cluster boundaries of each cluster we can do the predictions for new data. When a new data point comes we get the closest cluster of that data point. By calculating the distance between new data point and each cluster center we can select the closest cluster. After that we compare the distance of Its cluster boundary and the distance of that data point to Its cluster center. If that distance is greater than the cluster boundary we consider It as a anomalous data point since It is in outside the cluster. If it is less than cluster boundary we consider it as a normal data point since it is in inside the cluster.

Anomaly Detection using K means

Accuracy measures

Since we are considering the anomaly detection, a true positive would be a case where a true anomaly detected as a anomaly by the model.

As I said the anomaly detection is a special scenario. Always there will be an unbalanced distribution between anomalous and normal data.Therefore we need to be more focused on detecting anomalies. Therefore rather that calculating general prediction accuracy for all data points we should give a high priority to true positives than true negatives. Due to that nature we can’t go for more general accuracy measures. There are few good accuracy measures we can used for this scenario.

  • Sensitivity(recall) – gives the True Positive Rate. ( TP/(TP + FN) )
  • Precision – gives the probability of predicting a True Positive from all positive predictions ( TP/(TP+FP) )
  • PR cure – Precision recall(Sensitivity) curve – PR curve plots Precision Vs. Recall.
  • F1 score – gives the harmonic mean of Precision and Sensitivity(recall) ( 2TP / (2TP + FP + FN) )
Precision and recall

So Precision and the Sensitivity are the most suitable measures to measure a model where positive instances are very less. And PR curve and F1 score are mixtures of both Sensitivity and Precision. So PR curve and F1 score can be used to tell how good is the model. We can look into Sensitivity and Precision also separately depending on the exact scenario.

Precision or Recall?

This is mostly depends on the domain and how you look into that particular problem. For the anomaly detection case there can be two scenarios.

  1. Always detecting a true anomaly is the most important. In other words true positives are more important. As an example in a critical system like a space shuttle the system should be highly reliable.
  2. Not detecting a normal behavior as a anomaly is most important

As an example let’s consider a diagnostic of a cancer. It’s very important that identifying a cancer in the early stages. Therefore It’s very important that identifying all positives. So we should consider about the recall as the important accuracy measure here.

But also in the other hand although we identify most of the positives correctly we need to focus on reducing false positives as well. So getting true positives in the results is important. But if we get lot of false positives that might also be a problem. In this scenario then there can be lot of persons who does not have cancers will be identified as cancer patients due to those false positives. Recent study have shows that in breast cancers only 10% are true positives. So 90% of the results are false positives. That can be leads to lot of unnecessary problems.

So if the most important thing is reducing false positives we should consider the precision as the most relevant accuracy measure.
If the most important thing is detecting all positives as positives we should consider the recall (Sensitivity) as the most relevant accuracy measure.